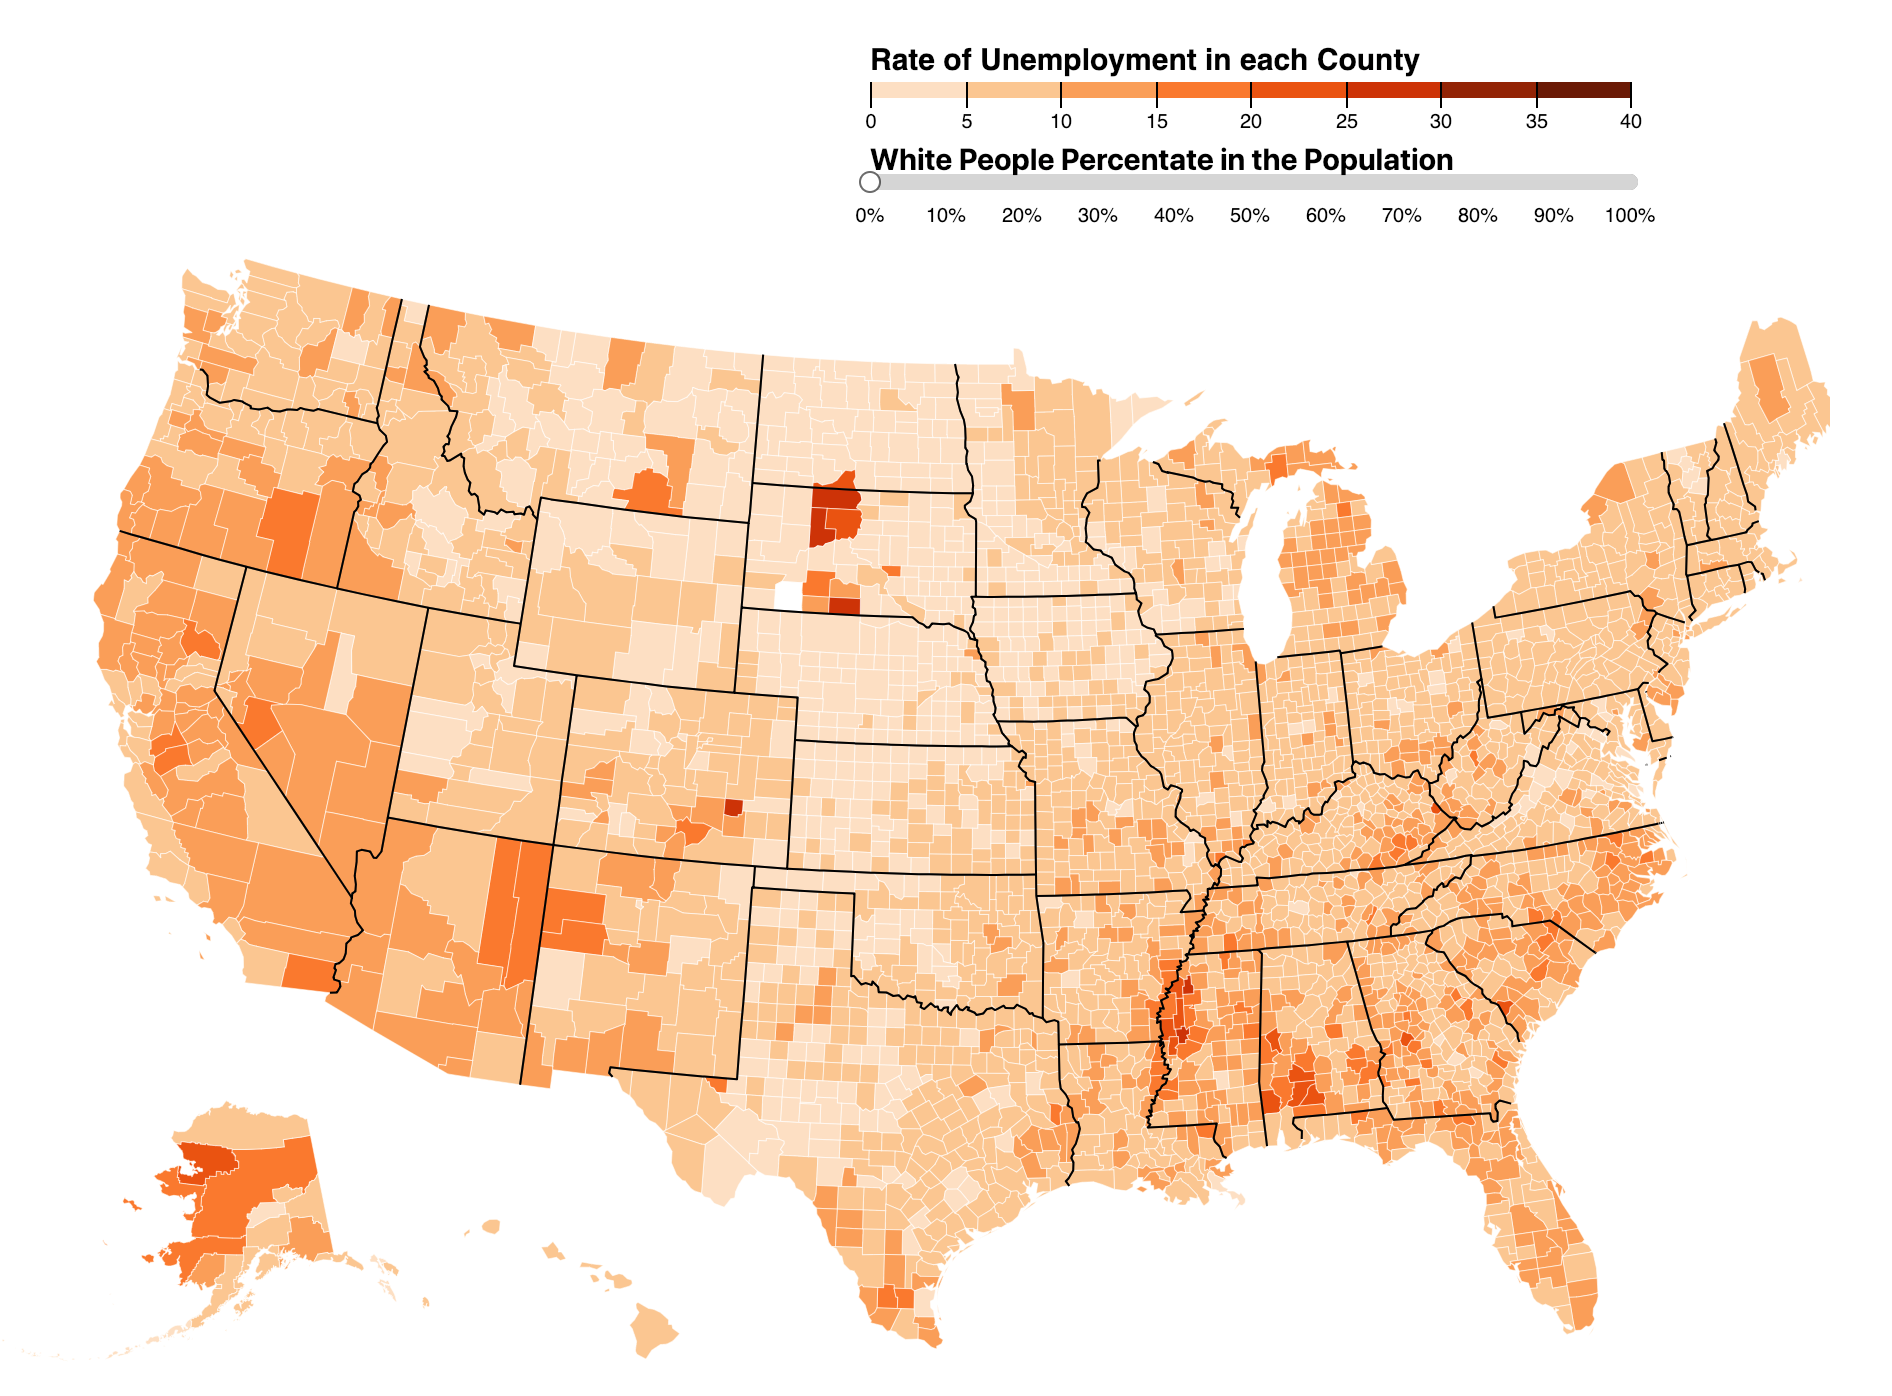
Creating customized colorbar
Published:
How to creating a customized colorbar with python? When creating heatmaps, we usually have
======
import matplotlib as mpl
import matplotlib.pyplot as plt
from matplotlib import cm
import matplotlib.colors as mcol
# matplotlib.use('Agg')

plt.imshow(mixup_example, cmap=plt.get_cmap('cool'))
#plt.imshow(mixup_example, cmap=cm1)
plt.axis('off')
plt.savefig('mixup.png', bbox_inches='tight',pad_inches = 0)
Reference Normally, the more features we use, the higher the likelihood that we can successfully separate the classes perfectly. Using too many features results in overfitting. The classifier starts learning exceptions that are specific to the training data and do not generalize well when new data is encountered. As the dimensionality increases, a larger percentage of the training data resides in the corners of the feature space. Then we should considering reduce the dimension of the features using such as Principal Component Analysis (PCA).
Explain over- and under-fitting and how to combat them?
cm1 = mcol.LinearSegmentedColormap.from_list("MyCmapName",[[1,0.4,0.4],[0.4,0.4,1]])
cnorm = mcol.Normalize(vmin=0,vmax=1)
cpick = cm.ScalarMappable(norm=cnorm,cmap=cm1)
cpick.set_array([])


